Automatic Measurements
SEGMENT, COUNT/SIZE, CLASSIFY, and ANALYZE
Image-Pro’s technique for performing Automatic Measurements is the foremost solution for gathering data from images by segmentation systems. Our simple step-wise approach to the problem is designed to provide the ultimate flexibility to analyze nearly any image type while remaining simple enough to quickly learn and teach to others.
1 Segment Identify what you want to measure in the image
2 Count/Size Create object outlines, instantly counted and sized
3 Classify Separate objects into custom groups by parameter
4 Analyze Generate data for making helpful comparisons
1 SEGMENT
Identify what you want to measure
Histogram-based Segmentation
Use the method that best suites the image and identify what you want to measure
-
Select a single intensity range
Use histogram-based methods to select your areas of interest, instantly highlighting them as objects on the image. For high contrast images use the Auto Dark and Auto Bright methods.
-
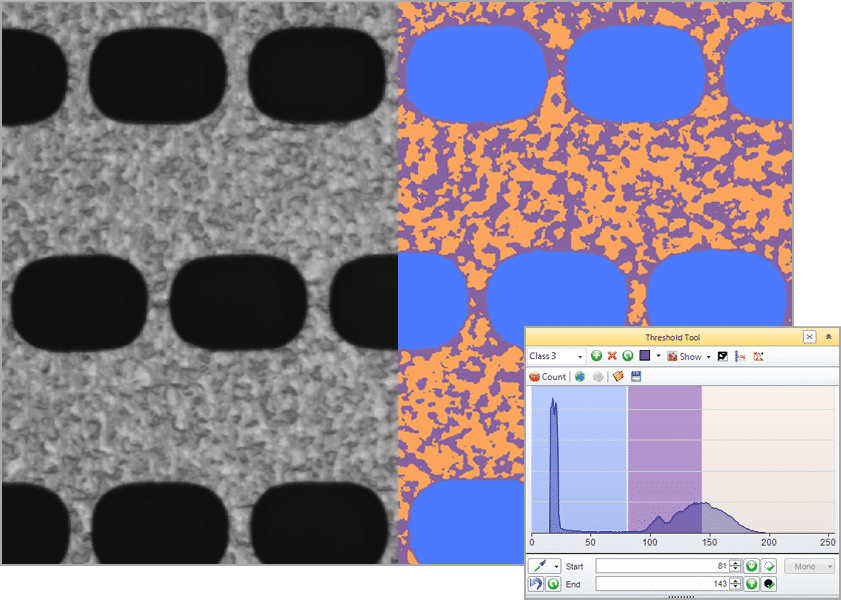
Select multiple intensity ranges (classes)
Don’t stop at a single range, add any number of classes to segment any range of intensities, whether contiguous or spaced apart on the histogram, classes can be a great way to find various materials in an image.
-
Select with the picker
This simple, but handy, tool enables you to use a range of sizes for the picking area under the cursor and select those pixels as the representative selection on the histogram for your segmentation.
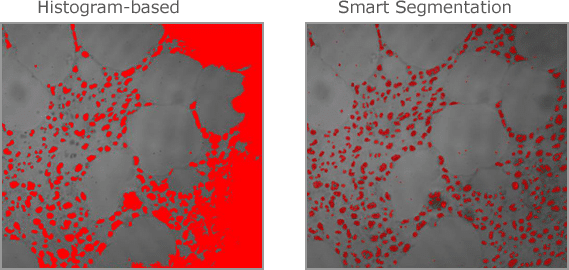
Smart Segmentation
A revolutionary new method that employs a pixel classification algorithm able to identify hard to segment objects and regions. Use Smart Segmentation to identify faintly-colored objects, textured objects, and objects or regions on uneven backgrounds.
-
Select objects and background
Easily add object markers to the image to identify representative samples of your objects or regions and lastly add a background marker. Set up multiple object classes and even create select multiple regions per class to refine the representative pixels.
-
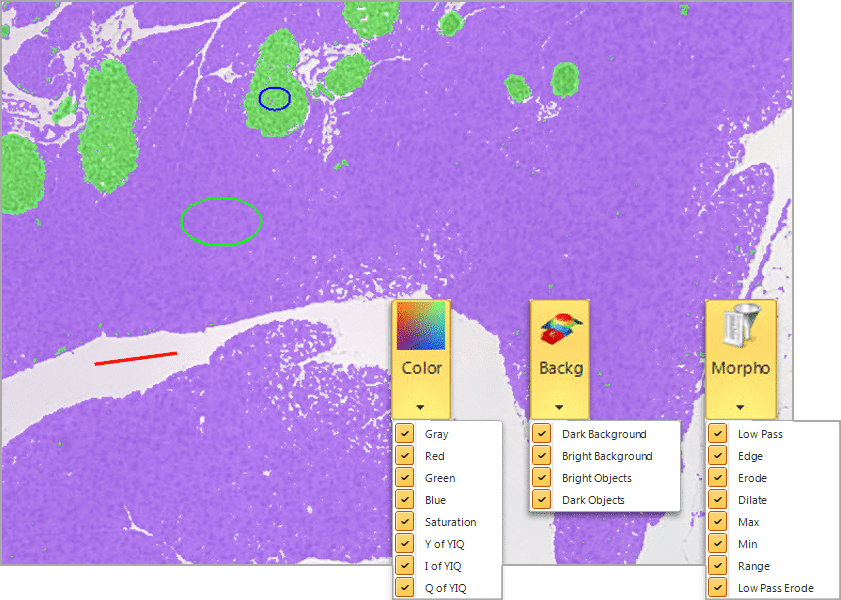
Define the recipe parameters
Use a range of “recipe” options to segment, including Intensity, Color, Background and Morphological Filters. Once you have a recipe that fits your segmentation needs, you can save and reapply to other images. For more complex samples a custom option can pre-apply filters.
-
Train over multiple images
Most experiments require the acquisition of many images from one or more samples. Smart Segmentation makes this analysis easy because the algorithm can be trained over a range of images in order to learn how your objects should be most accurately segmented.
Smart Segmentation solves common problems.
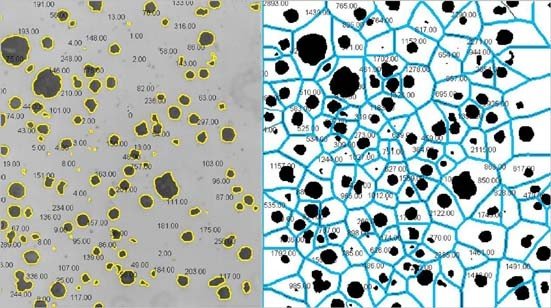
Automatically compensate for uneven backgrounds
Select two regions, and Smart Segmentation will automatically calculate the difference in the unevenly illuminated background. This is normally very difficult with histogram-based methods as objects will typically be the same intensity as some areas of the background.
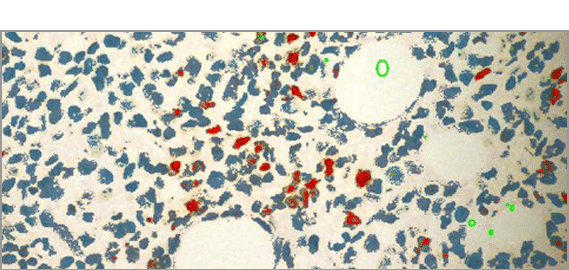
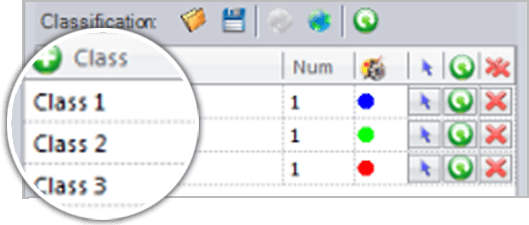
Select & Classify Objects by Color
Locate and segment objects based on their color. Create new classes to further characterize and streamline data collection and reporting. Creating classes is easy, and doesn’t have a limit to how many you can create, in order to make it easy to organize important objects.
2 COUNT/SIZE
Create object outlines, instantly counted and sized
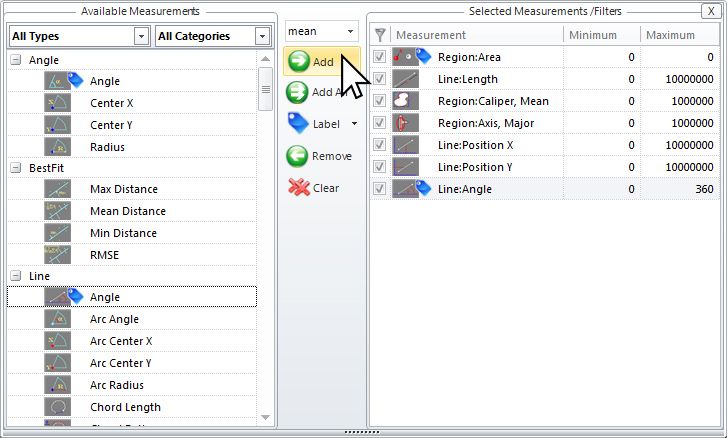
Filter by Measurement
Choose from a wide number of measurements to filter the entire segmentation group from and apply specific range restrictions (graphically or numerically) that selectively leave your objects of interest for further classification and measurement.
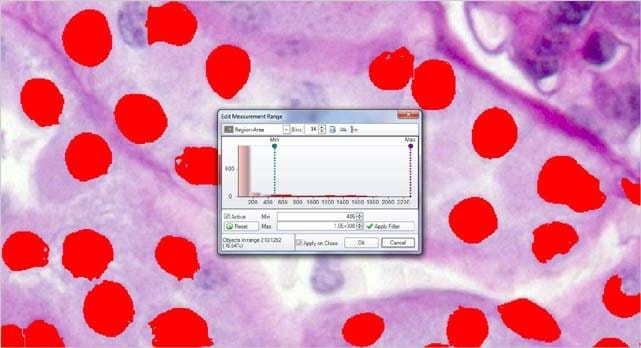
Area = ( 486 – Max )
Objects in range = 210
Filter out objects to be counted and sized by any number and combinations of parameters.
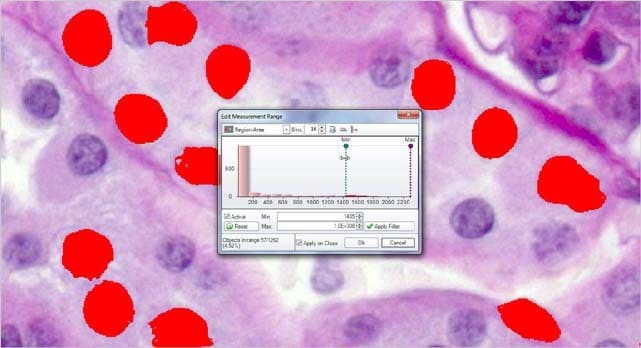
Area = ( 1486 – Max )
Objects in range = 57
Reduce the segmented objects down to the proper number and then press COUNT/SIZE.
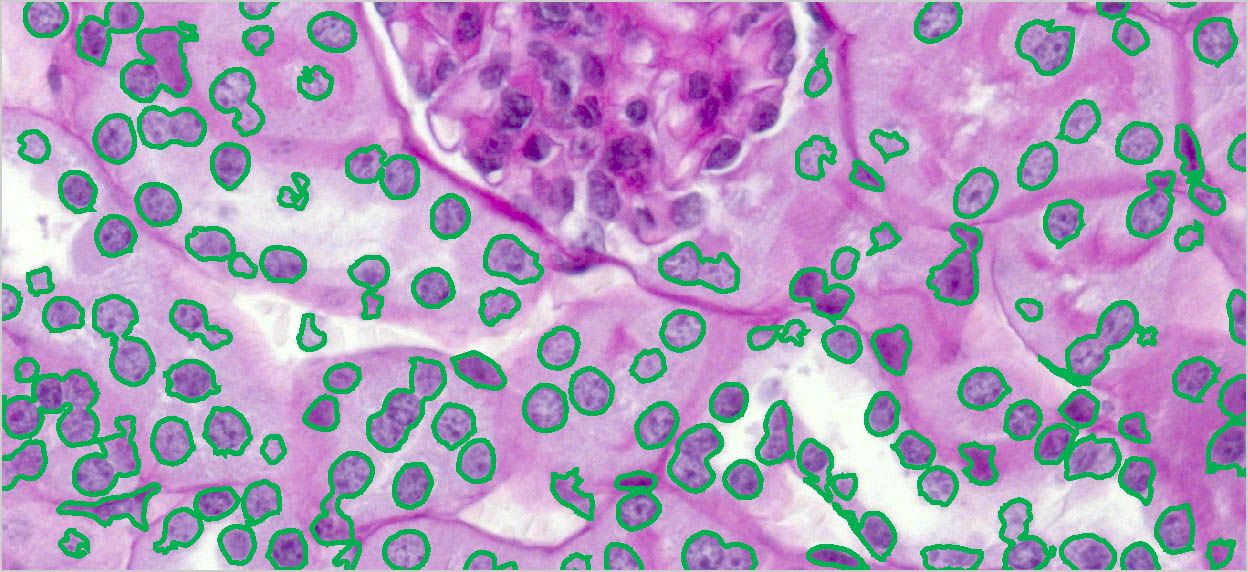
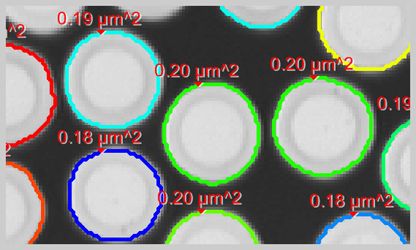
Create object outlines.
Once objects are identified and outlined you can count and measure areas, percent area, regions, intensity values, and more.
Count Number
All discrete, separate objects can be automatically counted within the set range of intensities.
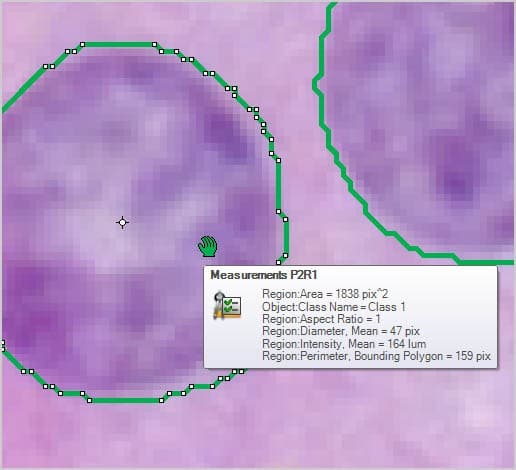
Size and Shape
Automatically measure object area, percent area, perimeter, length & width, radii and feret ratio, etc.
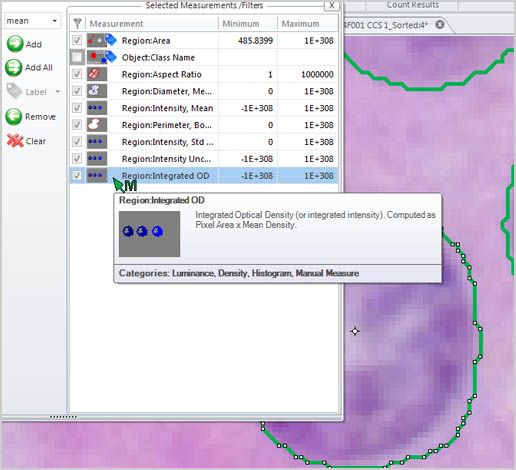
Intensity and Density
Automatically measure object intensity, integrated optical density, density, and intensity over time.
Object Splitting & Merging
It becomes necessary to split touching objects in many images so we’ve provided both automatic watershed and boundary shape-based splitting techniques as well as a manual point-to-point and polyline-based splitting methods to get the job done.
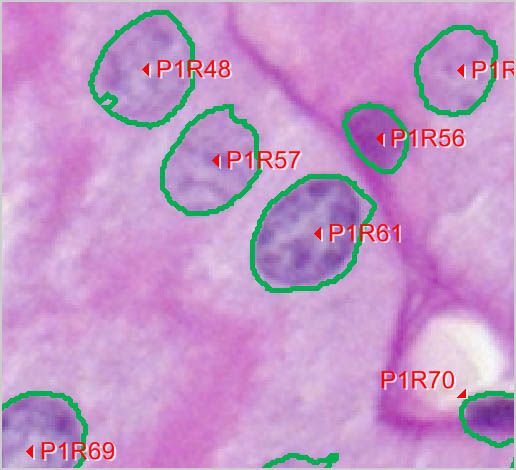
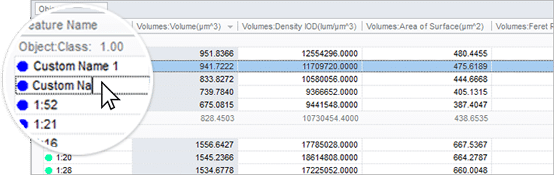
Object naming and coloring
This makes it easier to keep track of what’s what by allowing each object to receive a unique name and color through the editing of the data table. Change a single object or select a large number of objects and change them as a group.
Eliminate objects touching image border
In cases where you only want complete and intact volumes that are not cut off by the image stack’s borders you can enable a clean borders setting to ignore these objects.
Fill Holes
The appearance of each object is very important to accurate visualization so parameters for each object are able to be edited including color, transparency, specularity.
3 CLASSIFY
Separate objects into custom groups by parameter
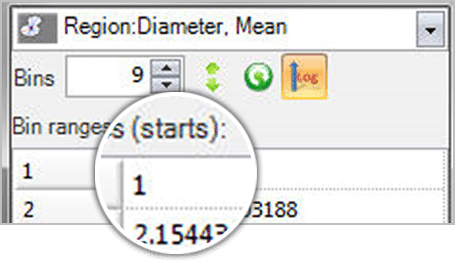
Single Variable Classification
Define any number of classification bins, set the first and last values of each bin, and assign classes to objects according to the bin ranges. Use any parameter in the measurement list to classify the objects by that “single” variable.
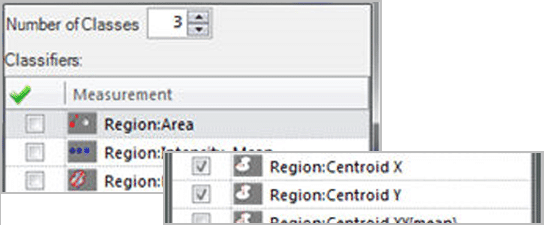
Auto Classification
Define the number of groups to be created, choose all the measurement parameters to be used for the classification, and then apply hierarchical clustering to the objects. Classes will be assigned based on the cluster created by cutting the clustering tree where the number of branches correspond to the number of requested classes.
Learning Classification
Classify objects using multiple parameters based on manually selected reference objects. This is an especially useful technique when you are not certain which parameters to use for the classification, but have some idea of how the objects should appear per class.
4 ANALYZE
Generate data for making helpful comparisons
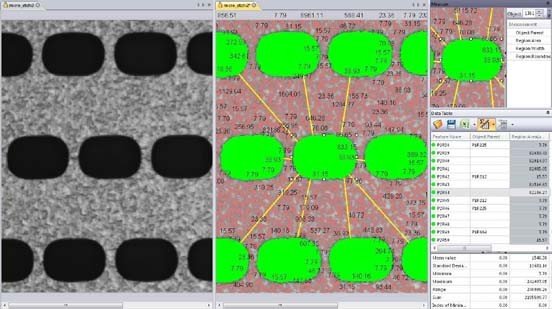
Measure Distances Between Objects
Measure one-to-one and one-to-many distances between objects.
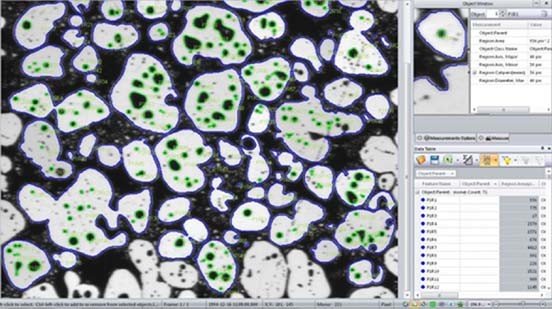
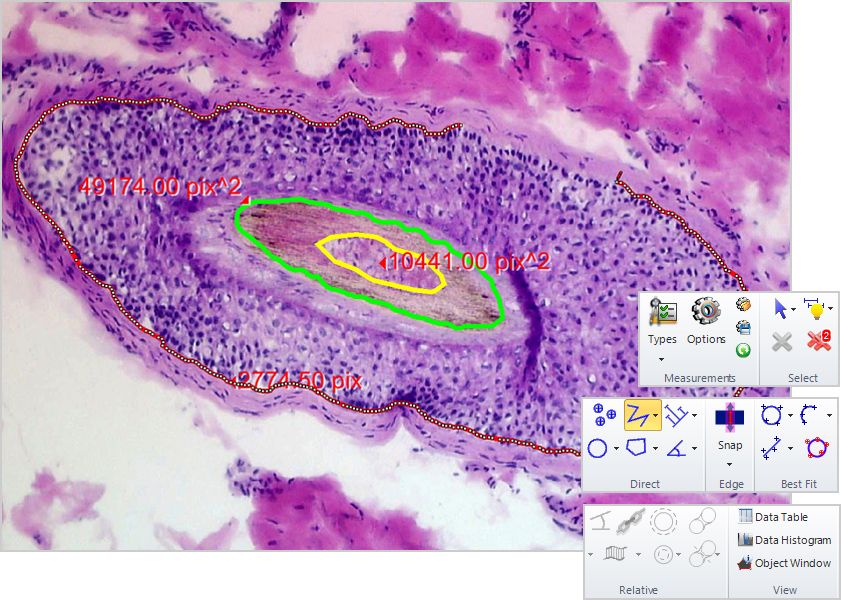
Measure Objects within Objects
Analyze parent/child relationships with tools that allow you to automatically measure and group objects within objects.
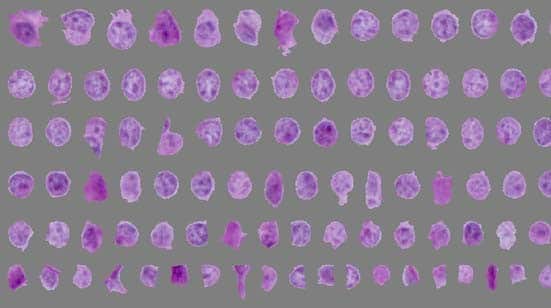
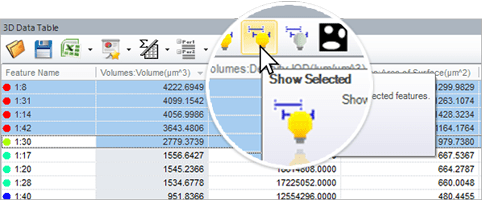
Sort Counted Objects
Create a new image displaying all counted objects arranged by size.
Analyze the Spatial Distribution of Objects
Measure and Analyze
Extract quantitative data with ease
Image-Pro Premier has been designed for a diverse user base and a multitude of applications. Whether in the materials science research lab, the quality assurance room, or the manufacturing floor, Premier’s semi-automated measurement and editing tools enable accurate and expedient analysis.
Calibrate for accuracy
Calibration data is ideally read from the image, however is cases where it does not exist, we offer a variety of options to easily create and apply a calibration to an image
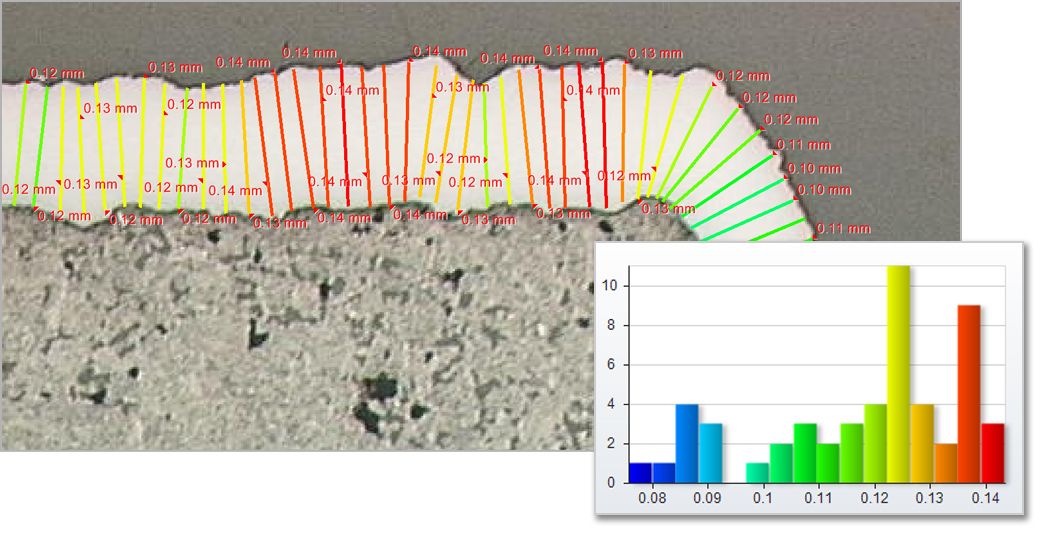
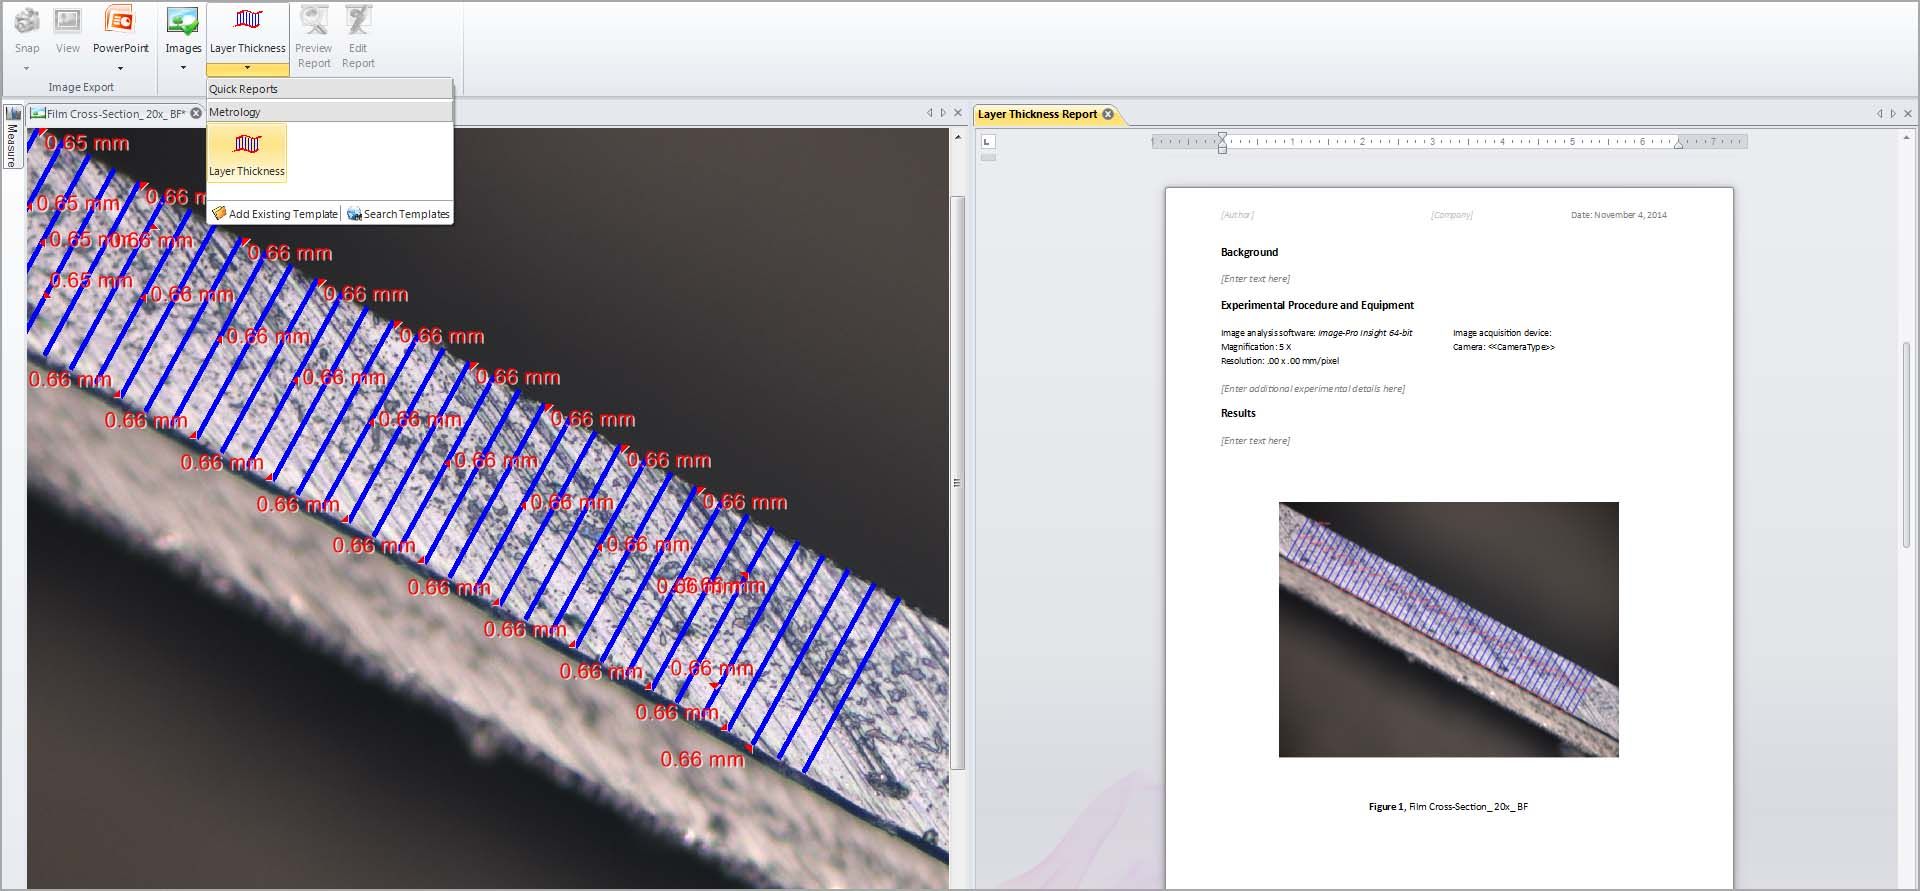
Measure Layer Thickness
Determine the top and bottom edges and allow the software to measure thickness and statistics about longest and shortest lengths.
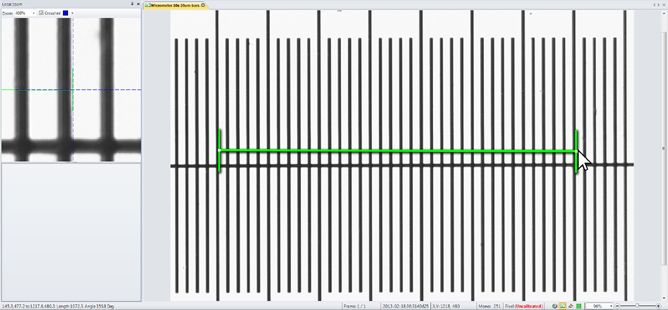
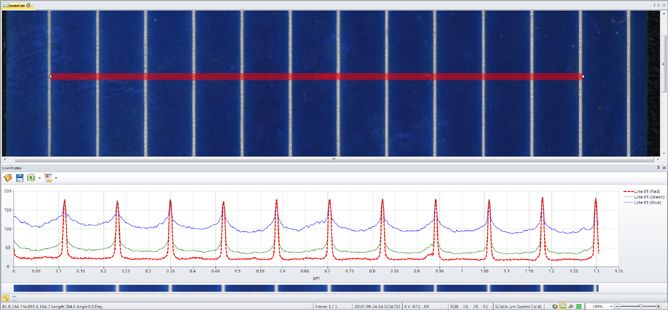
Measure Line Profile
Draw a variety of lines and shapes for displaying the intensity under the lines as Line Profiles. Apply any number of line profiles and export the graph and data out to Excel or to a custom report.
Measurement tools
-
Direct and Relative
Extract accurate data from your calibrated images with a wide range of manual and semi-automated measurement tools.
-
Manual and Auto Tracing
Draw polylines and regions to trace complex objects for you to measure area, perimeter, and length.
-
Magic Wand Counting
One-click automatic segmentation of the local area based on the pixels clicked. Refine selection with ‘Add’ and ‘Remove’.
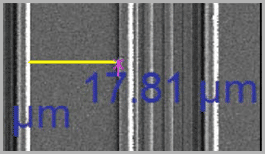
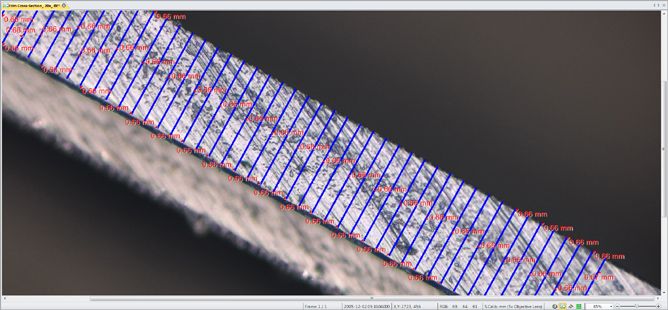
Magnetic Snap Measurements
Draw accurate line measurements every time with the Snap Measurement tools. Simply draw and the measurement will accurately snap along object edges.
Classify measurements
Use different colors, shapes, and custom names to classify and organize your measurement data. Use to organize measurements for greater clarity.
Data Management
Make the data work for you
Choose from 40+ measurements to display in tables and graphs
Rename and adjust
Rename objects by clicking and typing in the table. Also arrange all objects by color coded class to see relationships.
Sort and Condense
Sort by measurements and adjust tables to only show the relevant data.
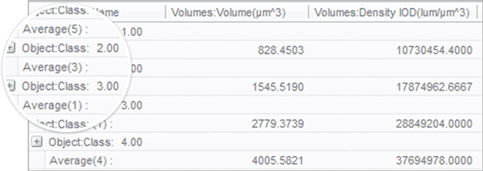
Group and view statistics
Combine classes of similar objects into a custom hierarchy and see statistics per measurement for each grouped class.
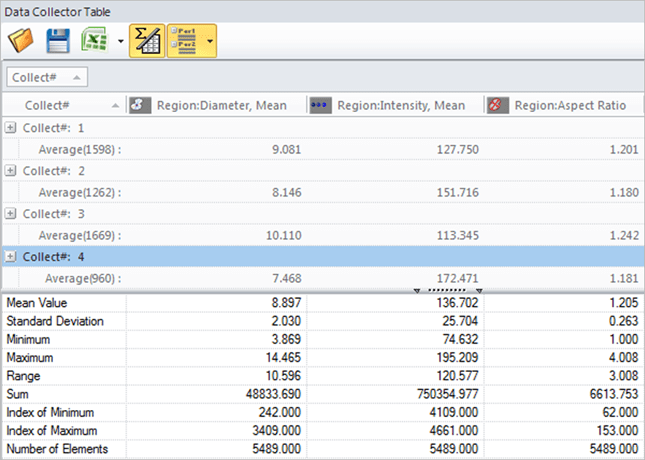
Data Collector
Gather data from multiple experiments
-
Collect data automatically
With the press of a button all the data from your table is compiled into Data Collector. You can even set it up to collect from all images automatically as they are measured.
-
Keep data linked to images
For a multi-image experiment, collect large clusters of data from each image separately and retain the original links to understand how image groups compare and contrast.
-
Graph the results
Use a variety of graph types for your data such as 2D and 3D scatterplots, histograms, block charts and lines graphs.
Export Data
Export your data and statistics to Microsoft Excel, File, or the Clipboard for pasting anywhere on your PC.
Send data to reports
Send your data and screenshots to custom designed reports within Image-Pro for fast and easy creation of experiment results.
Process and Enhance
Prepare your images
One-click Color Composite
Build composite color images by simply right-clicking on each grayscale image to select a color tint.
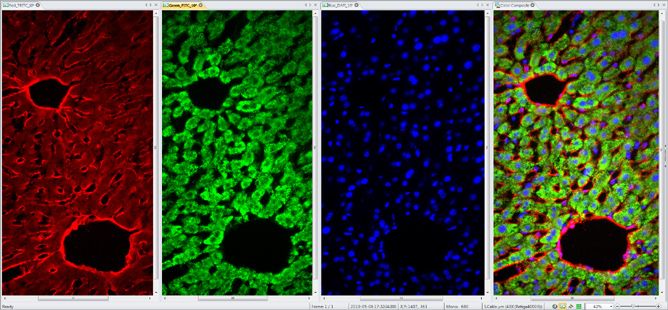
Extract and Merge Channels
Easily combine and separate images into RGB, HSI, and HSL color channels.
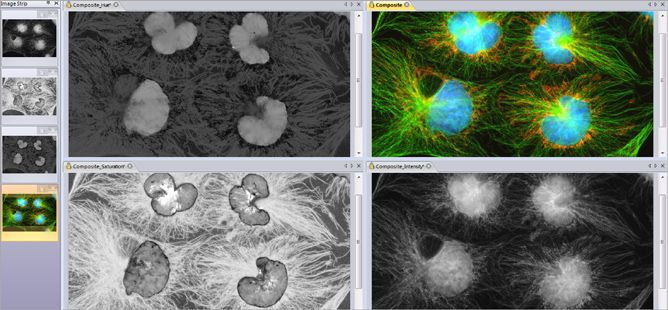
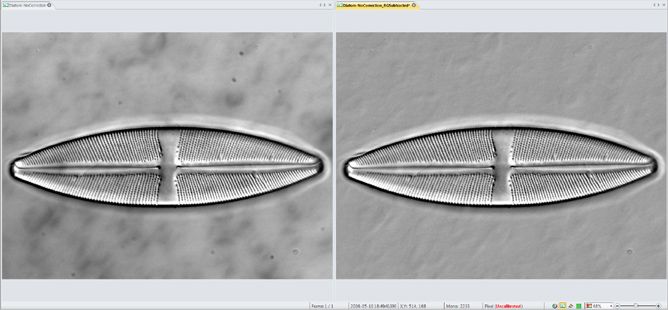
Image Correction
Correct your image background to better distinguish image objects, improving the downstream measurement operations and reducing false positives.
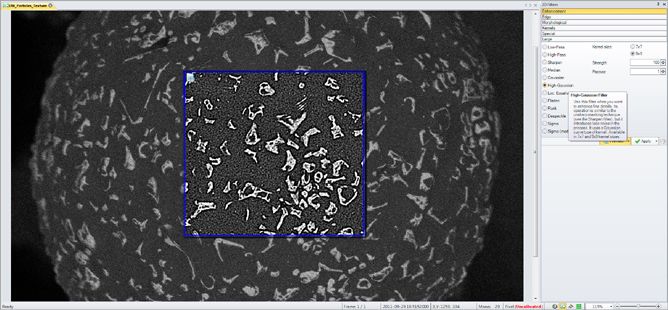
Image Filters
Remove background noise and reveal hidden details with an extensive set of image processing filters. Preview filters on your active image for instant results.
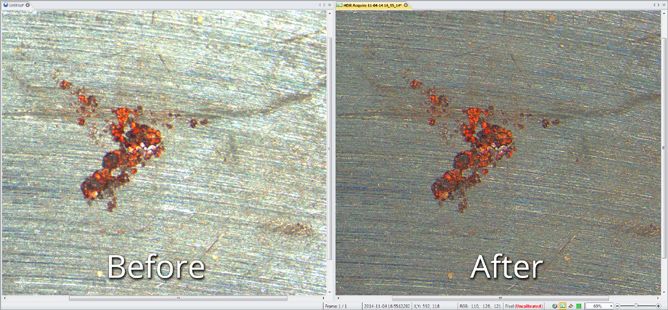
HDR Post process
Capture a sequence of images at different exposures, with variable options, and combine them into a single High Dynamic Range image. The resulting image is a compilation of image data using the widest possible range of dark to light pixels. No more black or saturated pixels.
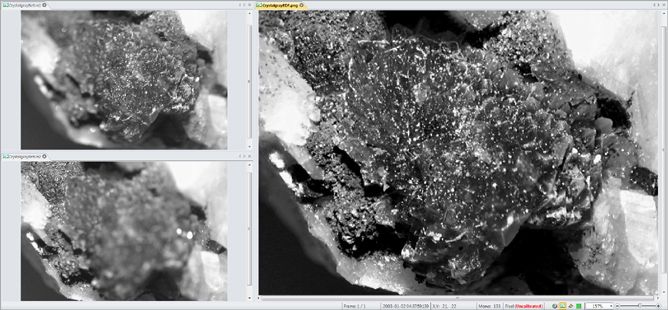
Alignment & EDF
Correct for microscope shift with post-acquisition auto-alignment tools. Extended Depth of Focus (EDF) creates a focused image from a series of images captured at different z planes.
Report and Share
Prepare your images for what’s next
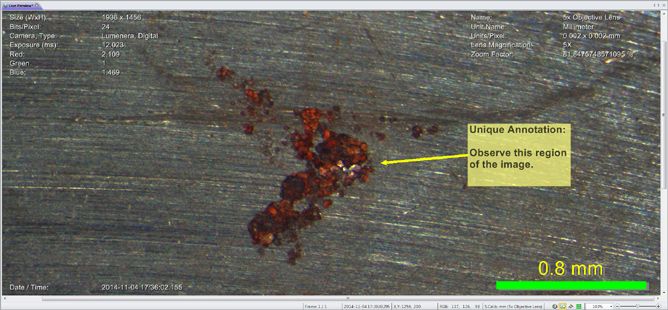
Annotations
Draw arrows, text annotations, meta-data overlays, Date/Time stamps, calibration marker bars and more.
Quick Reports
Send data and images to Premier’s report generator, able to create simple custom reports based on pre-defined templates. Print or export to Word or PDF.
Automatic Measurements
SEGMENT, COUNT/SIZE, CLASSIFY, and ANALYZE
Image-Pro’s technique for performing Automatic Measurements is the foremost solution for gathering data from images by segmentation systems. Our simple step-wise approach to the problem is designed to provide the ultimate flexibility to analyze nearly any image type while remaining simple enough to quickly learn and teach to others.
1 Identify what you want to measure in the image
2 Count/Size Create object outlines, instantly counted and sized
3 Classify Separate objects into custom groups by parameter
4 Analyze Generate data for making helpful comparisons
1 SEGMENT
Identify what you want to measure
Histogram-based Segmentation
Use the method that best suites the image and identify what you want to measure
-
Select a single intensity range
Use histogram-based methods to select your areas of interest, instantly highlighting them as objects on the image. For high contrast images use the Auto Dark and Auto Bright methods.
-
Select multiple intensity ranges (classes)
Don’t stop at a single range, add any number of classes to segment any range of intensities, whether contiguous or spaced apart on the histogram, classes can be a great way to find various materials in an image.
-
Select with the picker
This simple, but handy, tool enables you to use a range of sizes for the picking area under the cursor and select those pixels as the representative selection on the histogram for your segmentation.
Smart Segmentation
A revolutionary new method that employs a pixel classification algorithm able to identify hard to segment objects and regions. Use Smart Segmentation to identify faintly-colored objects, textured objects, and objects or regions on uneven backgrounds.
-
Select objects and background
Easily add object markers to the image to identify representative samples of your objects or regions and lastly add a background marker. Set up multiple object classes and even create select multiple regions per class to refine the representative pixels.
-
Define the recipe parameters
Use a range of “recipe” options to segment, including Intensity, Color, Background and Morphological Filters. Once you have a recipe that fits your segmentation needs, you can save and reapply to other images. For more complex samples a custom option can pre-apply filters.
-
Train over multiple images
Most experiments require the acquisition of many images from one or more samples. Smart Segmentation makes this analysis easy because the algorithm can be trained over a range of images in order to learn how your objects should be most accurately segmented.
Smart Segmentation solves common problems.
Automatically compensate for uneven backgrounds
Select two regions, and Smart Segmentation will automatically calculate the difference in the unevenly illuminated background. This is normally very difficult with histogram-based methods as objects will typically be the same intensity as some areas of the background.
Select & Classify Objects by Color
Locate and segment objects based on their color. Create new classes to further characterize and streamline data collection and reporting. Creating classes is easy, and doesn’t have a limit to how many you can create, in order to make it easy to organize important objects.
2 COUNT/SIZE
Create object outlines, instantly counted and sized
Filter by Measurement
Choose from a wide number of measurements to filter the entire segmentation group from and apply specific range restrictions (graphically or numerically) that selectively leave your objects of interest for further classification and measurement.
Area = ( 486 – Max )
Objects in range = 210
Filter out objects to be counted and sized by any number and combinations of parameters.
Area = ( 1486 – Max )
Objects in range = 57
Reduce the segmented objects down to the proper number and then press COUNT/SIZE.
Create object outlines.
Once objects are identified and outlined you can count and measure areas, percent area, regions, intensity values, and more.
Count Number
All discrete, separate objects can be automatically counted within the set range of intensities.
Size and Shape
Automatically measure object area, percent area, perimeter, length & width, radii and feret ratio, etc.
Intensity and Density
Automatically measure object intensity, integrated optical density, density, and intensity over time.
Object Splitting & Merging
It becomes necessary to split touching objects in many images so we’ve provided both automatic watershed and boundary shape-based splitting techniques as well as a manual point-to-point and polyline-based splitting methods to get the job done.
Object naming and coloring
This makes it easier to keep track of what’s what by allowing each object to receive a unique name and color through the editing of the data table. Change a single object or select a large number of objects and change them as a group.
Eliminate objects touching image border
In cases where you only want complete and intact volumes that are not cut off by the image stack’s borders you can enable a clean borders setting to ignore these objects.
Fill Holes
The appearance of each object is very important to accurate visualization so parameters for each object are able to be edited including color, transparency, specularity.
3 CLASSIFY
Separate objects into custom groups by parameter
Single Variable Classification
Define any number of classification bins, set the first and last values of each bin, and assign classes to objects according to the bin ranges. Use any parameter in the measurement list to classify the objects by that “single” variable.
Auto Classification
Define the number of groups to be created, choose all the measurement parameters to be used for the classification, and then apply hierarchical clustering to the objects. Classes will be assigned based on the cluster created by cutting the clustering tree where the number of branches correspond to the number of requested classes.
Learning Classification
Classify objects using multiple parameters based on manually selected reference objects. This is an especially useful technique when you are not certain which parameters to use for the classification, but have some idea of how the objects should appear per class.
4 ANALYZE
Generate data for making helpful comparisons
Measure Distances Between Objects
Measure one-to-one and one-to-many distances between objects.
Measure Objects within Objects
Analyze parent/child relationships with tools that allow you to automatically measure and group objects within objects.
Sort Counted Objects
Create a new image displaying all counted objects arranged by size.
Analyze the Spatial Distribution of Objects
Measure and Analyze
Extract quantitative data with ease
Image-Pro Premier has been designed for a diverse user base and a multitude of applications. Whether in the materials science research lab, the quality assurance room, or the manufacturing floor, Premier’s semi-automated measurement and editing tools enable accurate and expedient analysis.
Calibrate for accuracy
Calibration data is ideally read from the image, however is cases where it does not exist, we offer a variety of options to easily create and apply a calibration to an image
Measure Layer Thickness
Determine the top and bottom edges and allow the software to measure thickness and statistics about longest and shortest lengths.
Measure Line Profile
Draw a variety of lines and shapes for displaying the intensity under the lines as Line Profiles. Apply any number of line profiles and export the graph and data out to Excel or to a custom report.
Measurement tools
-
Direct and Relative
Extract accurate data from your calibrated images with a wide range of manual and semi-automated measurement tools.
-
Manual and Auto Tracing
Draw polylines and regions to trace complex objects for you to measure area, perimeter, and length.
-
Magic Wand Counting
One-click automatic segmentation of the local area based on the pixels clicked. Refine selection with ‘Add’ and ‘Remove’.
Magnetic Snap Measurements
Draw accurate line measurements every time with the Snap Measurement tools. Simply draw and the measurement will accurately snap along object edges.
Classify measurements
Use different colors, shapes, and custom names to classify and organize your measurement data. Use to organize measurements for greater clarity.
Data Management
Make the data work for you
Choose from 40+ measurements to display in tables and graphs
Rename and adjust
Rename objects by clicking and typing in the table. Also arrange all objects by color coded class to see relationships.
Sort and Condense
Sort by measurements and adjust tables to only show the relevant data.
Group and view statistics
Combine classes of similar objects into a custom hierarchy and see statistics per measurement for each grouped class.
Data Collector
Gather data from multiple experiments
-
Collect data automatically
With the press of a button all the data from your table is compiled into Data Collector. You can even set it up to collect from all images automatically as they are measured.
-
Keep data linked to images
For a multi-image experiment, collect large clusters of data from each image separately and retain the original links to understand how image groups compare and contrast.
-
Graph the results
Use a variety of graph types for your data such as 2D and 3D scatterplots, histograms, block charts and lines graphs.
Export Data
Export your data and statistics to Microsoft Excel, File, or the Clipboard for pasting anywhere on your PC.
Send data to reports
Send your data and screenshots to custom designed reports within Image-Pro for fast and easy creation of experiment results.
Process and Enhance
Prepare your images
One-click Color Composite
Build composite color images by simply right-clicking on each grayscale image to select a color tint.
Extract and Merge Channels
Easily combine and separate images into RGB, HSI, and HSL color channels.
Image Correction
Correct your image background to better distinguish image objects, improving the downstream measurement operations and reducing false positives.
Image Filters
Remove background noise and reveal hidden details with an extensive set of image processing filters. Preview filters on your active image for instant results.
HDR Post process
Capture a sequence of images at different exposures, with variable options, and combine them into a single High Dynamic Range image. The resulting image is a compilation of image data using the widest possible range of dark to light pixels. No more black or saturated pixels.
Alignment & EDF
Correct for microscope shift with post-acquisition auto-alignment tools. Extended Depth of Focus (EDF) creates a focused image from a series of images captured at different z planes.
Report and Share
Prepare your images for what’s next
Annotations
Draw arrows, text annotations, meta-data overlays, Date/Time stamps, calibration marker bars and more.
Quick Reports
Send data and images to Premier’s report generator, able to create simple custom reports based on pre-defined templates. Print or export to Word or PDF.
Supported Devices
Image-Pro supports an ever growing list of scientific cameras to ensure a superior capture experience. Click the link below to browse our extensive database of supported devices.
Supported File Formats
System Requirements
Manufacturers change system specifications regularly so it is difficult to describe the exact configuration that is required to use Image-Pro Premier successfully. However, there are some important guidelines to consider before purchasing or upgrading your computer hardware for use with Image-Pro Premier.
Rule of Thumb:
Everything depends on memory and speed. For users who want the best possible experience and product performance we recommend that you review the requirements below and follow-up with a review of the hardware priorities to understand how the whole system plays a part in the applications performance.
|
Minimum |
Recommended |
| Operating System |
Windows 8.1 – 32 & 64-bit
Windows 7 – 32 & 64-bit
Windows 10 – 64 bit |
Windows 8.1 – 64 bit
Windows 7 – 64-bit
Windows 10 – 64 bit |
| Free Disk Space |
5 GB of available hard-disk space |
20 GB or more of available hard-disk space |
| Processor |
2.8 GHz CPU Intel quad-core processor or better |
3.0 GHz Intel quad-core processor or better |
| RAM |
4 GB of RAM |
16 GB RAM or more |
| Graphics Card |
NVIDIA
GeForce GTX Cards with 4GB graphics memory & Open GL 4.2 or higher |
NVIDIA
GeForce GTX Cards with 4GB graphics memory & Open GL 4.2 or higher |
| Drives |
DVD/CD-ROM drive |
DVD-ROM/CD-ROM drive |
| USB Port |
USB port required for hard licenses and offline license activation |
USB port required for hard licenses and offline license activation |
| Internet Connection |
Internet connection required for online services* |
Internet connection required for online services* |
| Internet Browser |
Internet Explorer version 9 or higher |
Internet Explorer version 9 or higher |
Important Notes:
*This product may allow you to access certain features that are hosted online (“online services”), provided you have a high-speed Internet connection. The online services include but are not limited to, automatic updates, support links, access to video tutorials, and more.
Microsoft .NET Framework 4.0 (automatically installed by application).
Specifications are subject to change
Watch the Image-Pro Premier Introduction Video

Image-Pro Premier Intro Video


Reviews
There are no reviews yet.